In this post we are going to discuss how to calculate the Average True Range (ATR). ATR is an indicator that measures volatility. Once we have ATR calculated, we use it to calculate and then plot the Keltner Channels. ATR was introduced by J. Welles Wilder in 1978 in his book:”New Concepts In Technical Trading Systems.” He also introduced more number of now popular technical indicators in his book. You can read this book. With the passage of time ATR as a measure of volatility has become more popular. Did you read the post on why you need to learn Python and Machine Learning?
This post is for educational purpose only. In this post we will be using Python scripting language for doing the calculations. Python is a powerful scripting language that is becoming the most powerful machine learning language. R is another scripting language that is often used for doing data science and machine learning. Python and R are 2 powerful scripting languages that you should learn and master. Reading these posts will give you a fair idea on how to use them in doing machine learning. Read the post where I show how to connect R with MT4.
Now there are many machine learning algorithms that you can use in your trading. Deep Learning is an area which is promising. I will write a few post on how to predict price using deep learning algorithms. Did you read the post on how to use decision tree algorithm in day trading? Before you become expert at algorithmic trading, you will have to master machine learning, data science, probability and statistics and languages like Java, C++, Python and R. Random Forest is a very popular machine learning algorithm that you should master. Random Forest builds a lot of decision trees and then use them for ensemble learning.
Calculating ATR Using Numpy
The most challenging task right now in artificial intelligence and machine learning is how to predict price. A lot of research is being done on how to predict price but the goals stay elusive. This is due to the feedback loop in the market. Markets are just us buying and selling. When something works, we all start using it which makes it useless. This is the feedback loop that helps the market to learn and change over time. Read this post on how to develop your Third Generation Artificial Intelligence Machine Learning Forex Indicator. Below is the python code for calculating the Average True Range (ATR) and the Keltner Channels!
#import numpy module
import numpy as np
import matplotlib.pyplot as plt

#read the GBPJPY clsoing price from the csv files
o, h, l, c=np.loadtxt("E:/MarketData/GBPUSD10080.csv", delimiter=',',
                      usecols=(2,3,4,5,), unpack=True)
#ATR is based on the low and high price of the last N days usually 20 days
N = 20
h = h[-N:]
l = l[-N:]


#calculate the prvious day closing price
PC = c[-N -1: -1]
#calculate the daily range
h - l
#calculate the difference between high and prvious close
h - PC
#calculate the difference between previous closing price and low
PC - l
#compute the true range
TR = np.maximum(h - l, h - PC, PC - l)
#initialize ATR array
ATR = np.zeros(N)
ATR[0] = np.mean(TR)

for i in range(1, N):
    ATR[i] = (N - 1) * ATR[i - 1] + TR[i]
    ATR[i] /= N
Above was the Python code for calculating ATR using Numpy. As said above Python is a powerful scripting language. If you are a forex trader, then you must learn MQL4 language. MQL4 language will let you develop indicators and expert advisors for MT4. The only problem with MQL4 is that it lacks the powerful machine learning artificial intelligence libraries that are available in Python and R. You can take a look at our MQL4 Programming Course in which we teach you how to code your own indicators and expert advisors.
Calculating ATR and Keltner Channels Using Pandas
Now you must know this that Pandas is the a powerful Python data analysis library. It allows us to read the csv as a dataframe. Pandas are much more suited for doing the technical analysis. Below is the code that implements ATR And Keltner Channels using pandas.
import pandas as pd
#Average True Range
def ATR(df, n):
i = 0
TR_l = [0]
while i < df.index[-1]:
TR = max(df.get_value(i + 1, 'High'), df.get_value(i, 'Close')) - min(df.get_value(i + 1, 'Low'), df.get_value(i, 'Close'))
TR_l.append(TR)
i = i + 1
TR_s = pd.Series(TR_l)
ATR = pd.Series(pd.ewma(TR_s, span = n, min_periods = n), name = 'ATR_' + str(n))
df = df.join(ATR)
return df
#Keltner Channel
def KELCH(df, n):
KelChM = pd.Series(pd.rolling_mean((df['High'] + df['Low'] + df['Close']) / 3, n), name = 'KelChM_' + str(n))
KelChU = pd.Series(pd.rolling_mean((4 * df['High'] - 2 * df['Low'] + df['Close']) / 3, n), name = 'KelChU_' + str(n))
KelChD = pd.Series(pd.rolling_mean((-2 * df['High'] + 4 * df['Low'] + df['Close']) / 3, n), name = 'KelChD_' + str(n))
df = df.join(KelChM)
df = df.join(KelChU)
df = df.join(KelChD)
return df
#read the data from the csv file
data1 = pd.read_csv('E:/MarketData/EURUSD60.csv', header=None)
data1.columns=['Date', 'Time', 'Open', 'High', 'Low', 'Close', 'Volume']
data1.shape
#show data
data1=ATR(data1,14)
data1=KELCH(data1,14)
data1.tail()
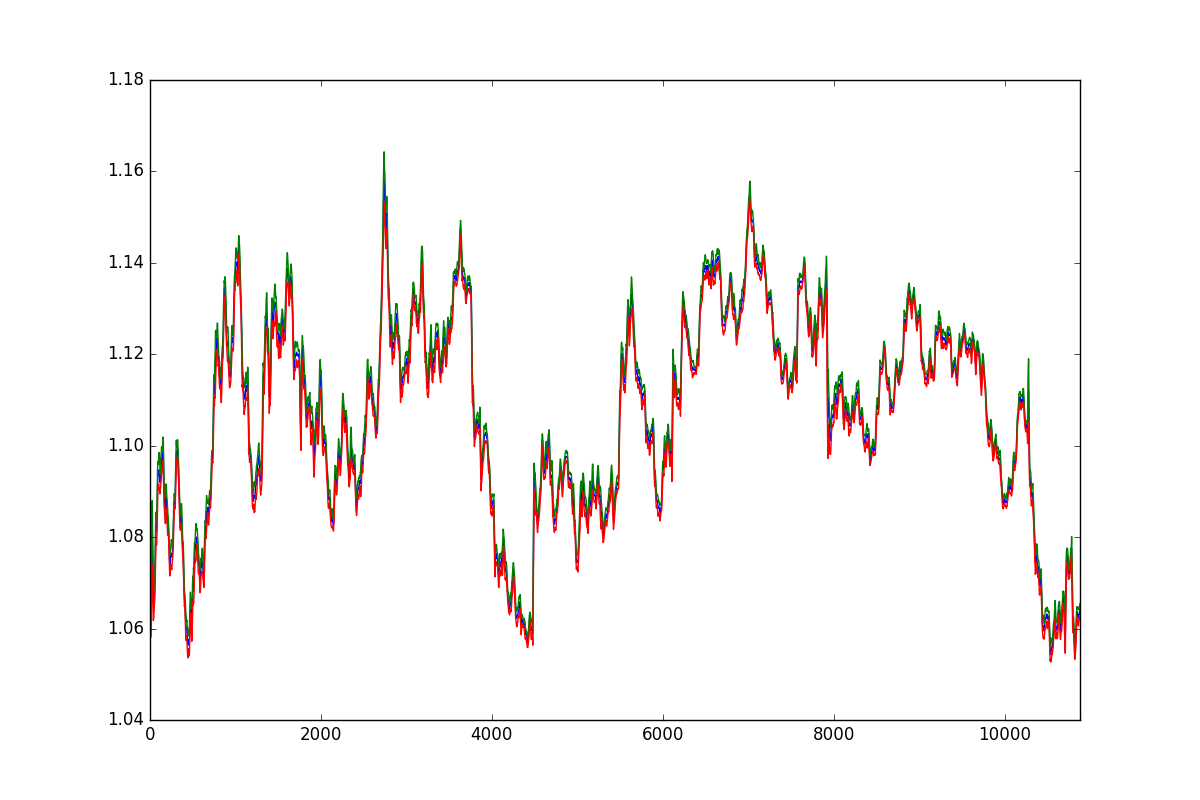
#plot the Keltner Channels
import matplotlib.pyplot as plt
data1['KelChM_14'].plot(figsize=(12,8));
data1['KelChU_14'].plot(figsize=(12,8));
data1['KelChD_14'].plot(figsize=(12,8));
plt.show()
When have calculated the 14 period ATR and Keltner Channels. We can change the period to any other period like 20, 50 whatever we think suits our trading strategy.Now when we run the above python code using pandas we get the following dataframe.
>>> data1.tail()
Date Time Open High Low Close Volume \
10876 2016.12.14 13:00 1.06410 1.06502 1.06350 1.06488 1302
10877 2016.12.14 14:00 1.06487 1.06558 1.06401 1.06417 1327
10878 2016.12.14 15:00 1.06424 1.06561 1.06379 1.06402 1753
10879 2016.12.14 16:00 1.06401 1.06508 1.06329 1.06398 1715
10880 2016.12.14 17:00 1.06396 1.06504 1.06386 1.06485 328
ATR_14 KelChM_14 KelChU_14 KelChD_14
10876 0.001544 1.063617 1.064975 1.062259
10877 0.001548 1.063760 1.065170 1.062350
10878 0.001584 1.063864 1.065271 1.062457
10879 0.001612 1.063930 1.065382 1.062477
10880 0.001554 1.064021 1.065483 1.062559