In this post I will discuss in detail how to program an indicator in MQL5. This is an educational post meant to teach how to code indicators in MQL5. If you have been trading forex for a while, you must have realized by now how much lucrative it can be if you start winning your trades. The major reason why you are losing most of your trades is that you are looking at the charts yourself all the time waiting for the right setup to appear. You have a mental picture in your mind that tells you the your trade setup. You have to constantly look at the charts and wait for that special trade setup to appear. It can take a few hours for that trade setup to appear. In the meantime you can get bored and start looking at other things in the room and ignore the charts when the trade setup appears. When you find the trade setup you are already late. You do this again and again on daily basis. In the process you get fatigued and tired. So this is the major reason why you are losing in forex. You have to look at the charts constantly. This bores you. You lose focus. When you lose focus the trade setup slips in front of you. You are late. At the end of the day you are tired and fatigued. Did you read the post on how to code MACD Signal Line Trailing EA?
What if you put a little effort and learn MQL5 programming language that is used to develop EAs and Indicators for MT5. You code your own indicator that looks for that special trade setup that you have been trading. You don’t need to look at the charts now. You can be watching TV when you receive the sound alert. You check the charts and you have a perfect trade setup. You open the trade and there is nothing to tire you. You can also be driving your car when you receive the alert on your smart phone. You can stop the car and take the trade. So you can well imagine how you can make things very easy by making a little effort to learn MQL5 and code your own indicator. So let’s start coding a simple indicator known as the Donchian Channel indicator. Watch this documentary on the Impact of Automated Trading Systems on the financial markets.
OnCalculate() Event Handler: When you code an indicator, you should know some basic things. The first thing is that it uses OnCalculate() event handler. Event handlers are important when coding eas and indicators. OnCalculate() event handler calculates the indicators value at each tick. Tick is the event when new price is received. Tick can be received multiple times in a minute which can be something like after every few seconds. There are two versions of OnCalculate() event handler. Did you read the post on EURUSD sell that made 150 pips with 10 pip stop loss?
First version is for those indicators that are based on a single price series like the moving average. When you use moving average you first choose whether you want the open, high, low or close price for calculating the moving average. Most of the time you will choose closing price for calculating the moving average. Below is the code for this version of OnCalculate():
int OnCalculate (const int rates_total,
// size of the price[] array
const int prev_calculated,
// bars handled on a previous call
const int begin,
// where the significant data start from
const double& price[]
// array to calculate
);
Above, you can see OnCalculate() is a function that returns an integer value. Now rates_total is the variable that contains the total number of bars in history for the currency chart symbol. Integer prev_calculated is the number of previous bars in history that have been already calculated. This helps in avoiding recalculating previous bars and only the new bar is calculated at each new tick. When we start the indicator, prev_calculate is zero. When new bars open, rates_total increases bt 1 and after that there will be a difference of 1 between rates_total and prev_calculated. Did you read the post on can artificial intelligence algorithms predict currency price?
Integer begin is seldom used so we will not worry about it here. Double price[] is the input.price time series used to make the calculations. When you choose moving average you choose whether you want to use open, high, low, close price. You can also use median price (HL/2), typical price (HLC/3) and the weighted close (HLCC/4). We will be needing the high and low of each bar in calculating the Donchian Channel. So we will be not using the above version of OnCalculate(). Instead we will be using the second version of OnCalculate().
int OnCalculate (const int rates_total,
// size of input time series
const int prev_calculated,
// bars handled in previous call
const datetime& time[],
 // Time
const double& open[],
// Open
const double& high[],
// High
const double& low[],
// Low
const double& close[],
// Close
const long& tick_volume[],
// Tick Volume
const long& volume[],
// Real Volume
const int& spread[]
// Spread
);
This is the version that we will use. This version has the open, high, low and close price.Now when you read MQL5 manual it says that OnCalculate() function returns a value that is then reflected in the prev_calculated. So let’s do an experiment and see how MQL5 works with OnCalculate(). With some practice with coding you will be able to troubleshoot most of the errors by writing simple test programs. Download this Trend Catcher Strategy 24 page PDF FREE. Below is the code. First read it. We first initialize a variable kk. Each time a new tick is received this variable will be increased.
#property copyright "Ahmad Hassam"
#property link      "http://tradingninja.com/"
#property version   "1.00"
#property indicator_chart_window
#property strict

//+------------------------------------------------------------------+
//| Custom indicator initialization function                         |
//+------------------------------------------------------------------+
int OnInit()
  {
//--- indicator buffers mapping

//---
   return(INIT_SUCCEEDED);
  }
//+------------------------------------------------------------------+
//| Custom indicator iteration function                              |
//+------------------------------------------------------------------+
int OnCalculate(const int rates_total,
                const int prev_calculated,
                const datetime &time[],
                const double &open[],
                const double &high[],
                const double &low[],
                const double &close[],
                const long &tick_volume[],
                const long &volume[],
                const int &spread[])
  {

static int kk;

kk++;

//---
Alert("--------------  "+IntegerToString(kk));

Alert("rates_total="+IntegerToString(rates_total));
Alert("prev_calculated="+IntegerToString(prev_calculated));

//--- return value of prev_calculated for next call
   return(kk);
  }
In the above code we check how OnCalculate() works. When we open the indicator, prev_calculated is zero and rates_total is equal to the number of bars in the memory which is 2549. with each tick, kk is incremented and pre_calculated is also incremented with prev_calculated=kk-1. So rates_total is the total number of bars in the memory when we open the MT5 platform. This is for educational purposes. Did you read the post on how to code trailing stop loss?
High Low Donchian Channel MQL5 Code
When coding an indicator, it is a good idea to start with MQL Wizard. Below is the code for our Donchian Channel indicator. This is what I have done. We will plot the high and low for the last 8 bars on the price chart. I have chosen 8 bars you can change it to 10, 20, 30 bars by changing the appropriate variable NoOfBars. Below is the Donchian Channel that you will see on your chart.
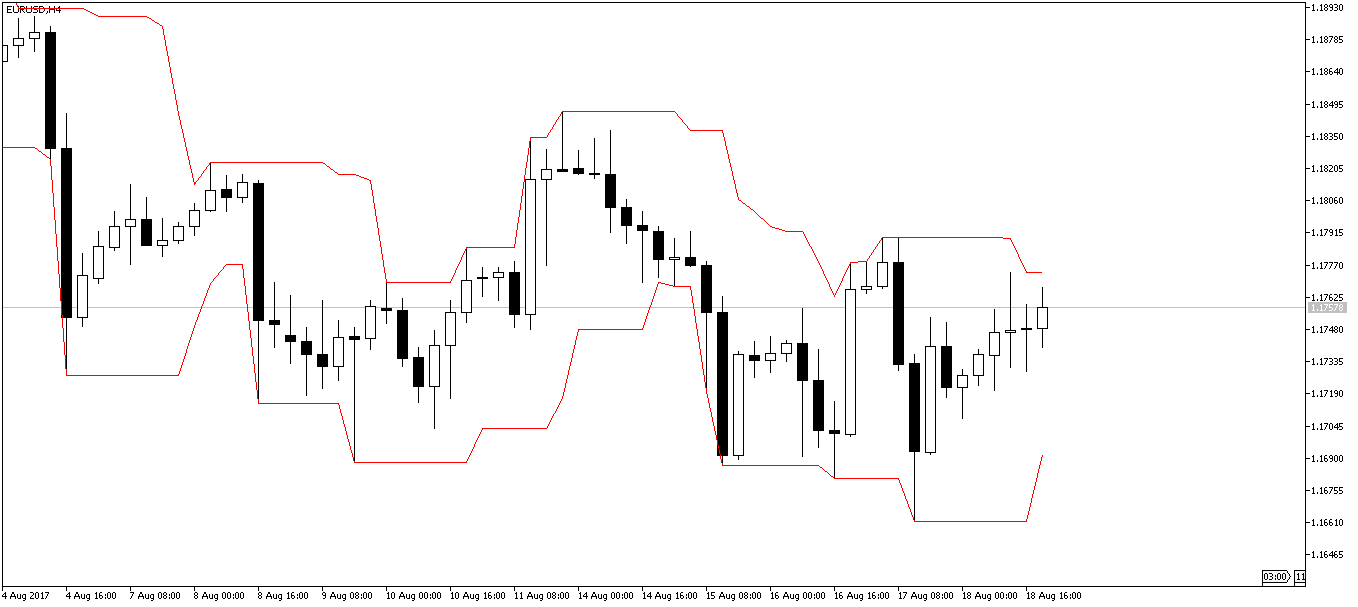
Donchian Channel indicator was developed by Richard Donchian. It plots the highest high and lowest low of the last n bars. In the above plot, we have plotted Donchian Channel for last 8 bars. 20 periods is the standard setting that most day traders use for this indicator. When price breaks above the upper line, you buy and when price breaks below the lower line, you sell. Donchiam Channel can be used both as a trending as well as a ranging indicator. By using another momentum indicator like RSI with this indicator, you can develop good trend trading strategies. Did you read the post on how to calculate the Average True Range and Keltner Channels?
//+------------------------------------------------------------------+
//|                                              DonchianChannel.mq5 |
//|                                                        Hassam    |
//|                                          http://tradingninja.com |
//+------------------------------------------------------------------+
#property copyright "Hassam"                                // A
#property link      "http://tradingninja.com"
#property version   "1.00"
#property indicator_chart_window
#property indicator_buffers 2
#property indicator_plots   2                               // A

//--- plot Upper Channel
#property indicator_label1  "Upper"                         // B
#property indicator_type1   DRAW_LINE
#property indicator_color1  clrRed
#property indicator_style1  STYLE_SOLID
#property indicator_width1  1                               // B

//--- plot Lower Channel
#property indicator_label2  "Lower"                        // C
#property indicator_type2   DRAW_LINE
#property indicator_color2  clrRed
#property indicator_style2  STYLE_SOLID
#property indicator_width2  1                               // C

//--- input parameters
input int      NoOfBars=8;                                  // D
//--- indicator buffers
double         UBuffer[];
double         LBuffer[];                                   // D

//+------------------------------------------------------------------+
//| Custom indicator initialization function                         |
//+------------------------------------------------------------------+

int OnInit()                                                   // E
  {
//--- indicator buffers mapping
   SetIndexBuffer(0,UBuffer,INDICATOR_DATA);
   SetIndexBuffer(1,LBuffer,INDICATOR_DATA);

//---
   return(0);                                                  // E
  }

//+------------------------------------------------------------------+
//| Custom indicator iteration function                              |
//+------------------------------------------------------------------+

int OnCalculate(const int rates_total,                              // F
                const int prev_calculated,
                const datetime &Time[],
                const double &Open[],
                const double &High[],
                const double &Low[],
                const double &Close[],
                const long &TickVolume[],
                const long &Volume[],
                const int &Spread[])                                // F
  {
//---

   ArraySetAsSeries(UBuffer,true);                                 // G
   ArraySetAsSeries(LBuffer,true);
   ArraySetAsSeries(High,true);
   ArraySetAsSeries(Low,true);                                     // G

   int bars = rates_total - 1;                                     // H
   if(prev_calculated > 0) bars = rates_total - prev_calculated;

   for(int i = bars; i >= 0; i--)
   {
   	UBuffer[i] = High[ArrayMaximum(High,i,NoOfBars)];
   	LBuffer[i] = Low[ArrayMinimum(Low,i,NoOfBars)];
   }

//--- return value of prev_calculated for next call
   return(rates_total);
  }                                                               // H
Before we proceed, you should go through the above code 2-3 times as we are now going to discuss the different segments of the code in detail. I have subdivided the code into subsection A, B, C, D, E, F, G and H. So let’s discuss each subsection below!
1- Preprocessor Directives– This is the section A in the code above. Preprocessor directives are used to set the program properties, include files and import functions. #property directive defines properties of the program that includes indicator names, script and library scripts. When we use the MQL Wizard, the author name, website link and the indicator version are automatically inserted at the top of the code. Of course I have inserted my name and the website link and the indicator version in the wizard. Did you read the post on USDJPY sell trade that made 160 pips with 10 pip stop loss?
#property indicator_chart_window: We will put this preprocessor directive at the top of the code we are telling the compiler that we want the indicator to be drawn right on the price chart like the moving averages. If we want to draw indicator in a separate window like MACD, we will use #property indicator_separate_window.
#property indicator_buffers: This preprocessor directive tells the compiler that we will be using 2 different buffers. Each buffer will draw a line. In MQL4 we could not use more than 8 buffers. In MQL5 this has been improved. Now in MQL5 we can use unlimited buffers. In this preprocessor directive we tell the compiler to reserve 2 buffers for calculations.
#property indicator_plot:s: This preprocessor directive tells the compiler that we will be drawing 2 lines for the indicator.
We haven’t used an include directive as we will be not using any classes in our custom. This is a simple program so we don’t use any classes.
2. Now we define the first buffer as Plot Upper Channel in section B. We have told the compiler that we will be using 2 buffers for our indicator. What are buffers? Buffers are dynamic arrays that we use to save indicator values. If we had been using C or C++ we would have been required to dynamic array ourselves. But in MQL5 life have been made easy for us by the Meta Quotes development team. They have done many things for us that we would have have done in other languages like C++, Java, Python or C#. Did you read this line #property indicator_type1 DRAW_LINE? Let’s discuss the different drawing styles in MQL5.
Different Drawing Styles in MQL5
There are 18 drawing styles in MQL5 as compared to 6 drawing styles in MQL4. So you can well imagine how much more versatile MQL5 is as compared to MQL4. We will need to provide the drawing style for each plot. We have defined 2 plots in our code namely the Upper Channel and the Lower Channel. The important drawing styles in MQL5 are below:
- DRAW_NONE : The is used when you don’t want to draw the indicator buffers on the chart.
- DRAW_LINE: This is the most obvious drawing style. This is used to draw a single line with a specified width on the chart. Moving averages of the different types, relative strength index, stochastic etc all these indicators use this DRAW_LINE style.In our code B we also use this drawing style for our Upper Channel plot with the #property indicator_style1 STYLE_SOLID.
- DRAW_ARROW : This will draw arrow objects on the chart. You can use this drawing style if you want to indicate where to buy/sell. Fractals indicator uses this DRAW_ARROW to show the swing highs and swing lows.
- DRAW_HISTOGRAM: This drawing style will draw a histogram oscillating above and below the zero line. MACD, OsMA etc use these drawing styles.
- DRAW_SECTION: This drawing style will connect prices on different bars with an unbroken line. ZigZag indicator uses this drawing style.
- DRAW_CANDLES: This drawing style will draw a sequence of candlesticks on the chart.
- DRAW_BARS: This drawing style will display a sequence of bars.
Now these were some important drawing styles that you should know. I have skipped DRAW_FILLING, DRAW_ZIGZAG, DRAW_SECTION, DRAW_COLOR_SECTION, DRAW_COLOR_CANDLES, DRAW_COLOR_BARS, DRAW_COLOR_ARROWS, DRAW_COLOR_HISTOGRAM, DRAW_COLOR_HISTOGRAM2, DRAW_COLOR_LINE. You can check them in MQL5 Reference Manual.
3. In subsection C we define the drawing style for plot 2 Lower Channel.
4. In subsection D, we define the variable NoOfBars. This variables tells how many bars we will be using in calculating the Donchian Channel. Then we define the Upper Buufer UBuffer[ ] and the lower buffer LBuffer[ ]. These 2 buffers will save the price data for the upper and the lower plots.
5. In E subsection we define the OnInit() event handler. This event handler is activated once we open the indicator. We use it to initialize the SetIndexBuffer() functions.
6. In F subsection we define the OnCalculate() event handler. I have discussed OnCalculate() event handler in detail in the beginning of this post.
7. G and H subsection define the Donchian channel Upper and Lower buffers.
After going through this post you should have a fair idea on how to code indicators in MQL5. Now you should try to code a few indicators on your own. This will help you a lot in taking your coding skills to a much high level. As said in the start of this post MQL5 is a subset of C++ language. C++ is a very powerful language that is used widely in algorithmic trading. If you know C++, you will have no problem in learning MQL5. If you want to learn C++, I have developed this course C++ for Traders. You can take a look at this course. I have also developed 2 more courses. One is the C++ Machine Learning for Traders course. This is once you have learned C++ and want to take your skill level to a much higher level by developing predictive models for price using machine learning algorithms. The other course is C++ Algorithmic Trading. In this course you learn how to connect C++ with MQL5 by developing a DLL files. Once we have developed DLL files that connect C++ with MQL5 we can then use powerful predictive models in C++ to code indicators in MQL5.